📈 Monitoring your node with Grafana and Prometheus
Prometheus is a monitoring platform that collects metrics from monitored targets by scraping metrics HTTP endpoints on these targets.
Grafana is a dashboard used to visualize the collected data.
Official documentation is available here.
1. Install Prometheus and Node Exporter
sudo apt-get install -y prometheus prometheus-node-exporter
2. Install Grafana
sudo apt-get install -y apt-transport-https
sudo apt-get install -y software-properties-common wget
sudo wget -q -O /usr/share/keyrings/grafana.key https://apt.grafana.com/gpg.key
echo "deb [signed-by=/usr/share/keyrings/grafana.key] https://apt.grafana.com stable main" | sudo tee -a /etc/apt/sources.list.d/grafana.list
sudo apt-get update && sudo apt-get install -y grafana
3. Enable services so they start automatically
sudo systemctl enable grafana-server prometheus prometheus-node-exporter
4. Create the prometheus.yml config file
Remove the default prometheus.yml configuration file and edit a new one.
sudo rm /etc/prometheus/prometheus.yml
sudo nano /etc/prometheus/prometheus.yml
Choose the tab for your consensus client. Paste the following configuration into the file.
- Lighthouse
- Nimbus
- Teku
- Prysm
- Lodestar
global:
  scrape_interval:     15s # By default, scrape targets every 15 seconds.

  # Attach these labels to any time series or alerts when communicating with
  # external systems (federation, remote storage, Alertmanager).
  external_labels:
    monitor: 'codelab-monitor'

# A scrape configuration containing exactly one endpoint to scrape:
# Here it's Prometheus itself.
scrape_configs:
   - job_name: 'node_exporter'
     static_configs:
       - targets: ['localhost:9100']
   - job_name: 'lighthouse'
     metrics_path: /metrics
     static_configs:
       - targets: ['localhost:8008']
   - job_name: 'lighthouse_validator'
     metrics_path: /metrics
     static_configs:
       - targets: ['localhost:8009']
global:
  scrape_interval:     15s # By default, scrape targets every 15 seconds.

  # Attach these labels to any time series or alerts when communicating with
  # external systems (federation, remote storage, Alertmanager).
  external_labels:
    monitor: 'codelab-monitor'

# A scrape configuration containing exactly one endpoint to scrape:
# Here it's Prometheus itself.
scrape_configs:
   - job_name: 'node_exporter'
     static_configs:
       - targets: ['localhost:9100']
   - job_name: 'Nimbus'
     metrics_path: /metrics
     static_configs:
       - targets: ['localhost:8008']
   - job_name: 'Nimbus_Validator'
     metrics_path: /metrics
     static_configs:
       - targets: ['localhost:8009']
global:
  scrape_interval:     15s # By default, scrape targets every 15 seconds.

  # Attach these labels to any time series or alerts when communicating with
  # external systems (federation, remote storage, Alertmanager).
  external_labels:
    monitor: 'codelab-monitor'

# A scrape configuration containing exactly one endpoint to scrape:
# Here it's Prometheus itself.
scrape_configs:
   - job_name: 'node_exporter'
     static_configs:
       - targets: ['localhost:9100']
   - job_name: 'Teku'
     metrics_path: /metrics
     static_configs:
       - targets: ['localhost:8008']
   - job_name: 'Teku_Validator'
     metrics_path: /metrics
     static_configs:
       - targets: ['localhost:8009']
global:
  scrape_interval:     15s # By default, scrape targets every 15 seconds.

  # Attach these labels to any time series or alerts when communicating with
  # external systems (federation, remote storage, Alertmanager).
  external_labels:
    monitor: 'codelab-monitor'

# A scrape configuration containing exactly one endpoint to scrape:
# Here it's Prometheus itself.
scrape_configs:
   - job_name: 'node_exporter'
     static_configs:
       - targets: ['localhost:9100']
   - job_name: 'validator'
     static_configs:
       - targets: ['localhost:8009']
   - job_name: 'Prysm'
     static_configs:
       - targets: ['localhost:8008']
global:
scrape_interval:     15s # By default, scrape targets every 15 seconds.

  # Attach these labels to any time series or alerts when communicating with
  # external systems (federation, remote storage, Alertmanager).
  external_labels:
    monitor: 'codelab-monitor'

# A scrape configuration containing exactly one endpoint to scrape:
# Here it's Prometheus itself.
scrape_configs:
   - job_name: 'node_exporter'
     static_configs:
       - targets: ['localhost:9100']
   - job_name: 'beacon'
     metrics_path: /metrics
     static_configs:
       - targets: ['localhost:8008']
   - job_name: 'validator'
     metrics_path: /metrics
     static_configs:
       - targets: ['localhost:8009']
5. Setup prometheus for your execution client
Append the applicable job snippet for your execution client to the end of prometheus.yml.
Spacing matters. Ensure all job_name snippets are in alignment.
- Geth
- Besu
- Nethermind
- Erigon
- Reth
   - job_name: 'geth'
     scrape_interval: 15s
     scrape_timeout: 10s
     metrics_path: /debug/metrics/prometheus
     scheme: http
     static_configs:
       - targets: ['localhost:6060']
   - job_name: 'besu'
     scrape_interval: 15s
     scrape_timeout: 10s
     metrics_path: /metrics
     scheme: http
     static_configs:
     - targets:
       - localhost:6060
   - job_name: 'nethermind'
     static_configs:
       - targets: ['localhost:6060']
   - job_name: 'erigon'
     scrape_interval: 10s
     scrape_timeout: 3s
     metrics_path: /debug/metrics/prometheus
     scheme: http
     static_configs:
       - targets: ['localhost:6060']
   - job_name: 'reth'
     metrics_path: "/"
     scrape_interval: 10s
     static_configs:
       - targets: ['localhost:6060']
Here's an example of a Lighthouse-Nethermind config:
global:
  scrape_interval:     15s # By default, scrape targets every 15 seconds.

  # Attach these labels to any time series or alerts when communicating with
  # external systems (federation, remote storage, Alertmanager).
  external_labels:
    monitor: 'codelab-monitor'

# A scrape configuration containing exactly one endpoint to scrape:
# Here it's Prometheus itself.
scrape_configs:
   - job_name: 'node_exporter'
     static_configs:
       - targets: ['localhost:9100']
   - job_name: 'Lighthouse'
     metrics_path: /metrics
     static_configs:
       - targets: ['localhost:5054']
   - job_name: 'validators'
     metrics_path: /metrics
     static_configs:
       - targets: ['localhost:5064']
   - job_name: 'nethermind'
     static_configs:
       - targets: ['localhost:6060']
To exit and save, press Ctrl + X, then Y, then Enter.
Update file permissions.
sudo chmod 644 /etc/prometheus/prometheus.yml
Restart the services.
sudo systemctl restart grafana-server prometheus prometheus-node-exporter
Verify that the services are running.
sudo systemctl status grafana-server prometheus prometheus-node-exporter
6. Create a SSH Tunnel to Grafana
Each time you want to access Grafana, create a SSH tunnel with port 3000 forwarded.
- Linux or MacOS
- Windows
Example of how to create a SSH tunnel in Linux or MacOS:
ssh -N -v <user>@<staking.node.ip.address> -L 3000:localhost:3000

#Full Example
ssh -N -v ethereum@192.168.1.69 -L 3000:localhost:3000
Example of how to create a SSH tunnel in Windows with Putty:
Navigate to Connection > SSH > Tunnels > Enter Source Port 3000 > Enter Destination localhost:3000 > Click Add
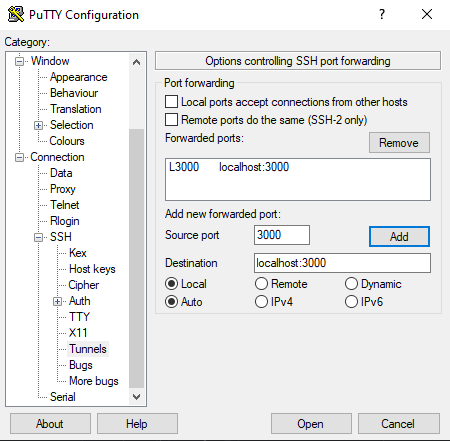
Now save your configuration. Navigate to Session > Enter a session name > Save
Click Open to open a connection
Now you can access Grafana on your local machine by pointing a web browser to http://localhost:3000
7. Setup Grafana Dashboards
- Open http://localhost:3000
- Login with admin / admin
- Change password
- Click the configuration gear icon, then Add data Source
- Select Prometheus
- Set Name to "Prometheus"
- Set URL to http://localhost:9090
- Click Save & Test
- Download and save your consensus client's json file. More json dashboard options available below. [ Lighthouse | Teku | Nimbus | Prysm | Prysm > 10 Validators | Lodestar ]
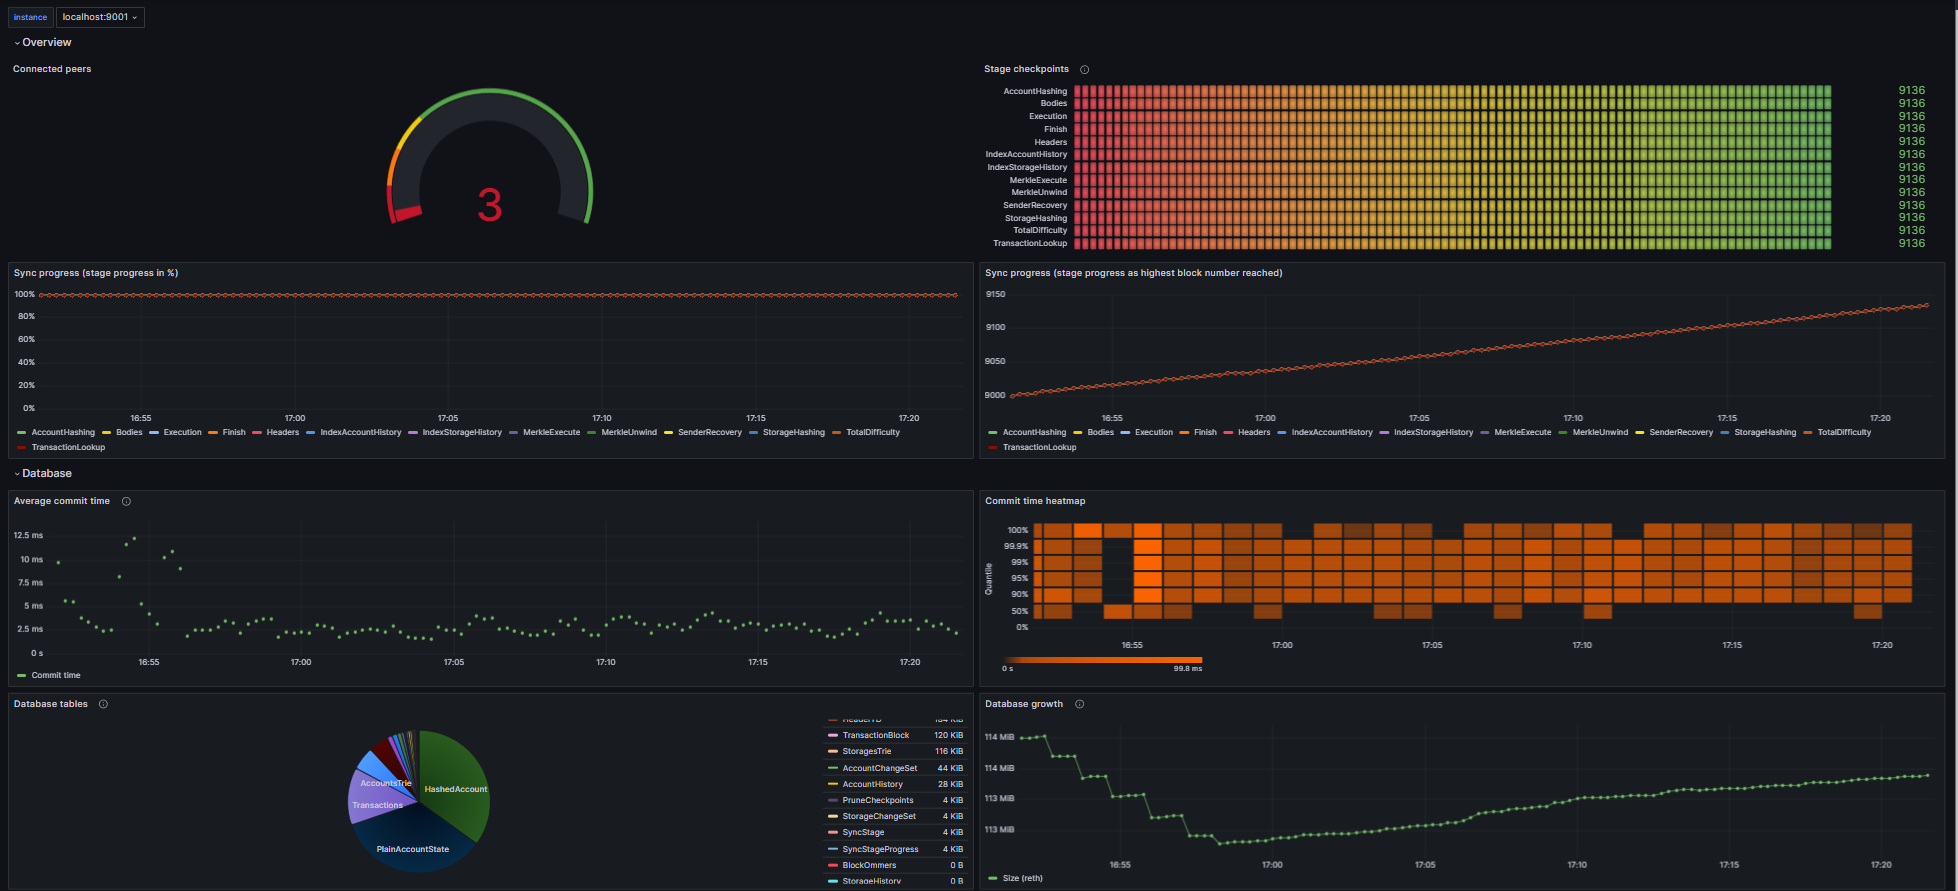
- Download and save your execution client's json file [ Geth | Besu | Nethermind | Erigon | Reth ]
- Download and save a node-exporter dashboard for general system monitoring
- Click Create + icon > Import
- Add the consensus client dashboard via Upload JSON file
- If needed, select Prometheus as Data Source.
- Click the Import button.
- Repeat steps 12-15 for the execution client dashboard.
- Repeat steps 12-15 for the node-exporter dashboard.
🔥 Troubleshooting common Grafana issues
Symptom 1: Your dashboard is missing some data_._
Solution 1: Ensure that the execution or consensus client has enabled the appropriate metrics flag.
cat /etc/systemd/system/execution.service
cat /etc/systemd/system/consensus.service
- Geth: --http --metrics --pprof
- Besu: --metrics-enabled=true
- Nethermind: --Metrics.Enabled true
- Erigon: --metrics
- Reth: --metrics 127.0.0.1:9001
- Lighthouse: --validator-monitor-auto
- Nimbus: --metrics --metrics-port=8008
- Teku: --metrics-enabled=true --metrics-port=8008
- Lodestar: --metrics true
Symptom 2: Don't want to use SSH tunnels and you want to expose port 3000 to access Grafana, but understand the security concerns.
Solution 2: Open port 3000 in your ufw firewall. Access grafana at http://<node ipaddress>:3000
sudo ufw allow 3000
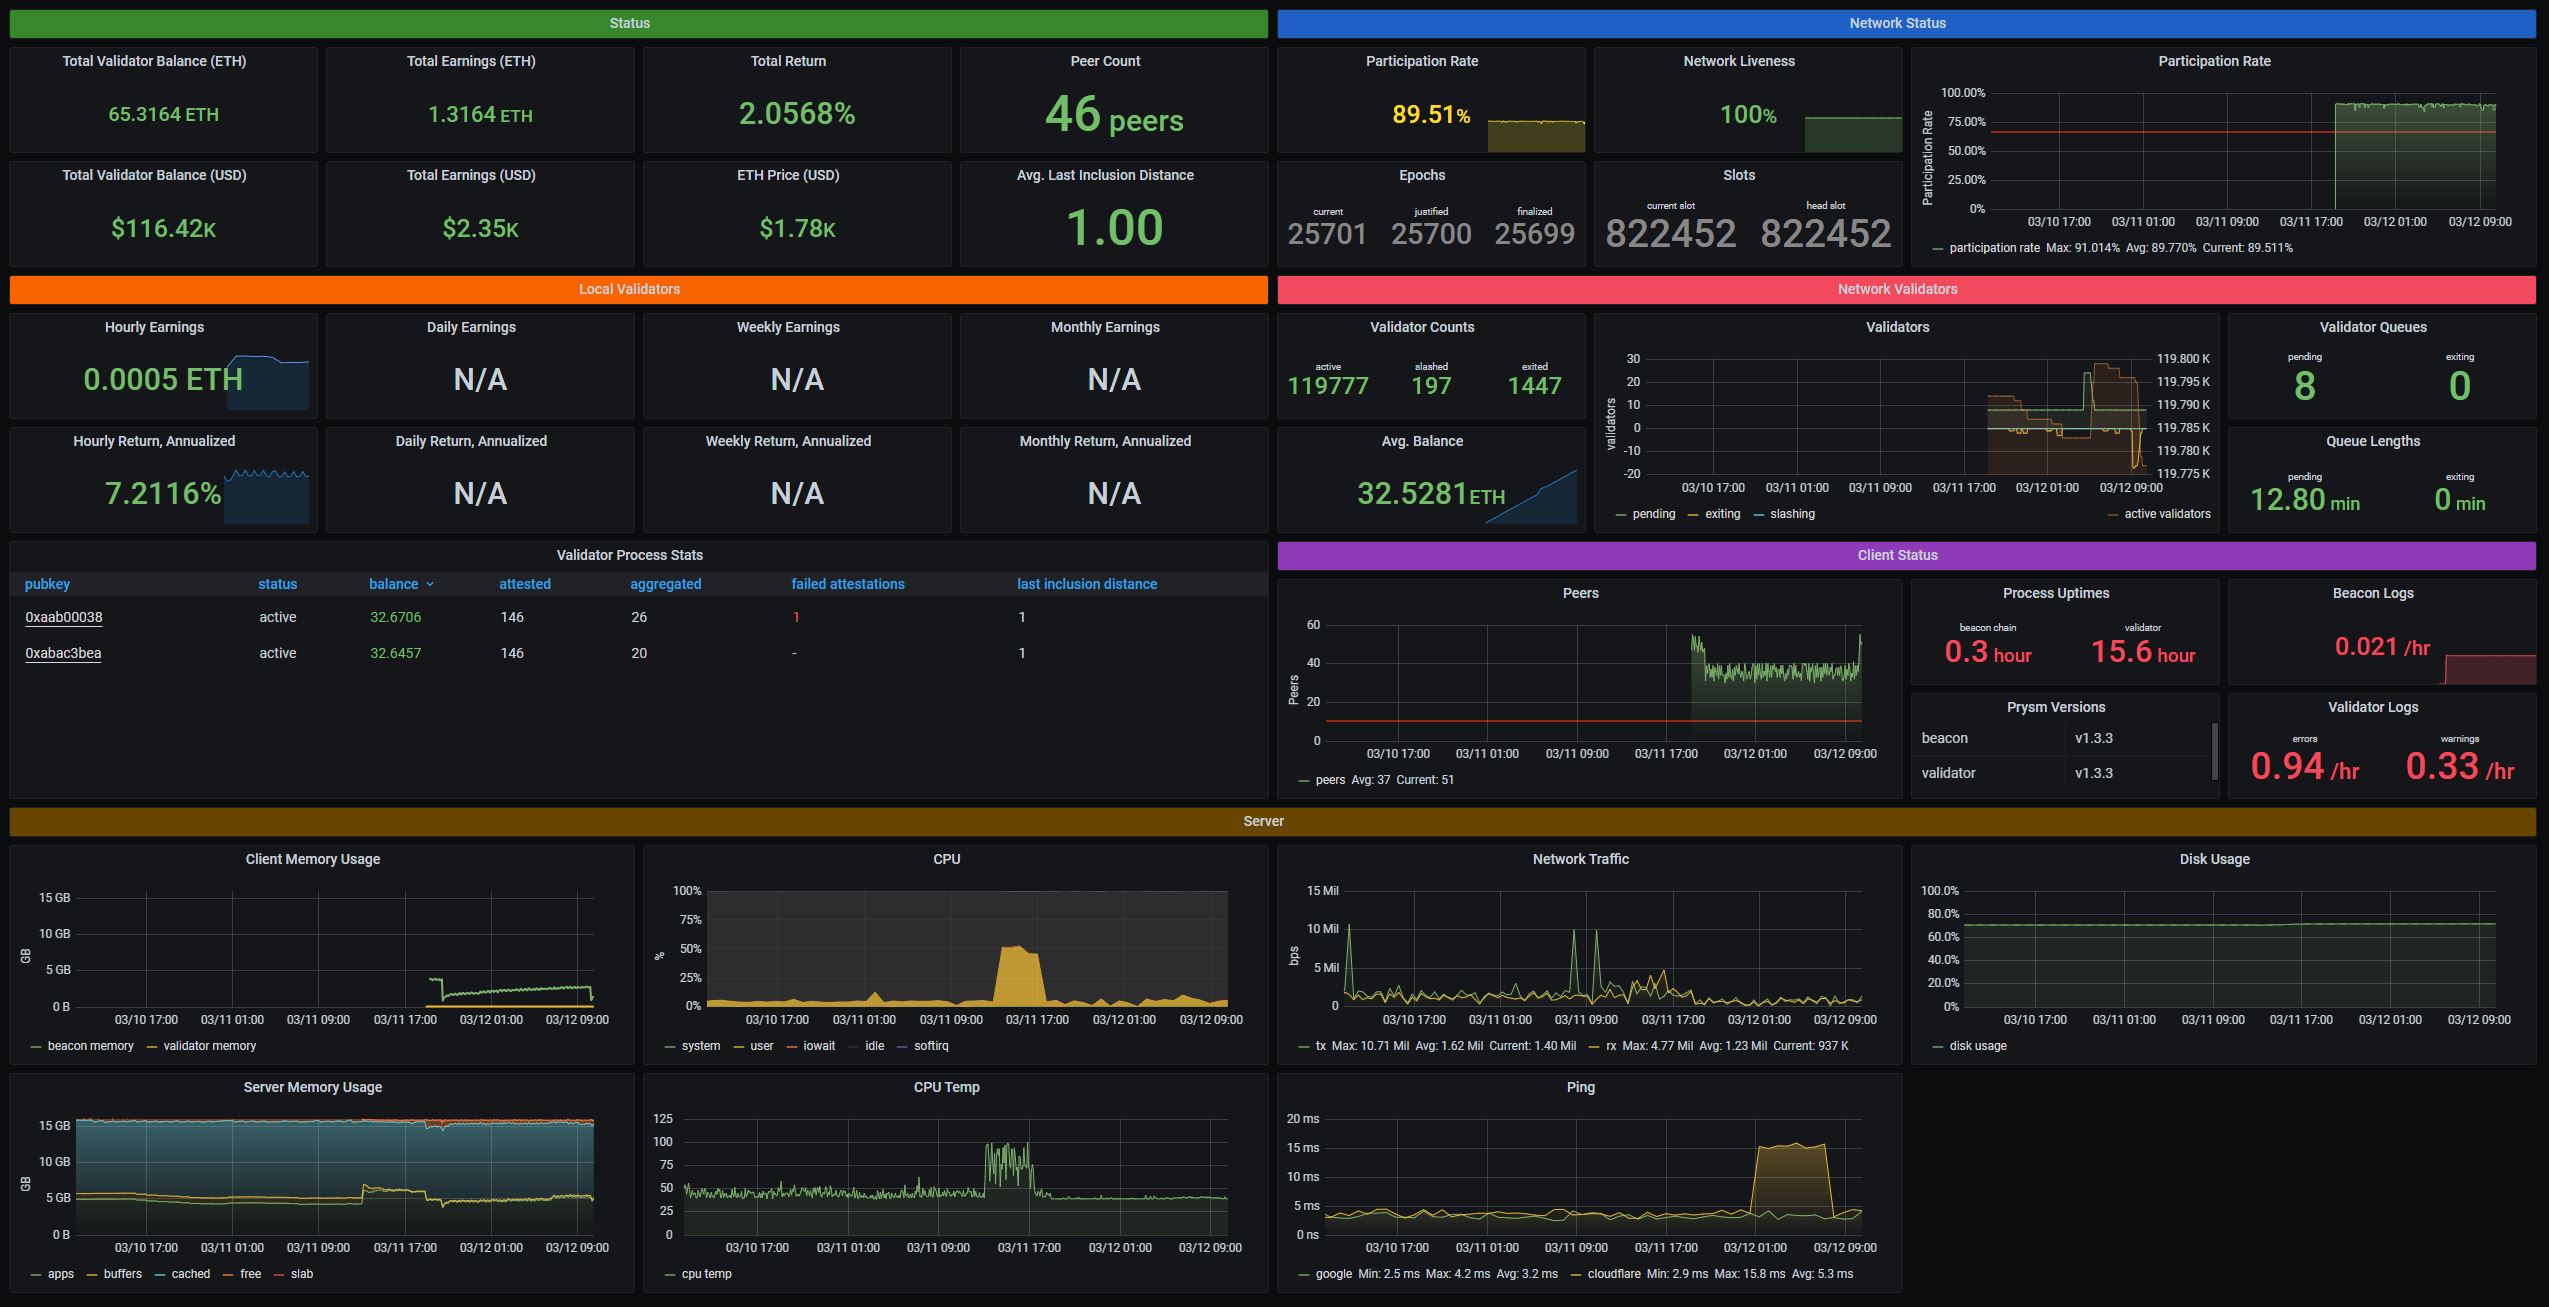
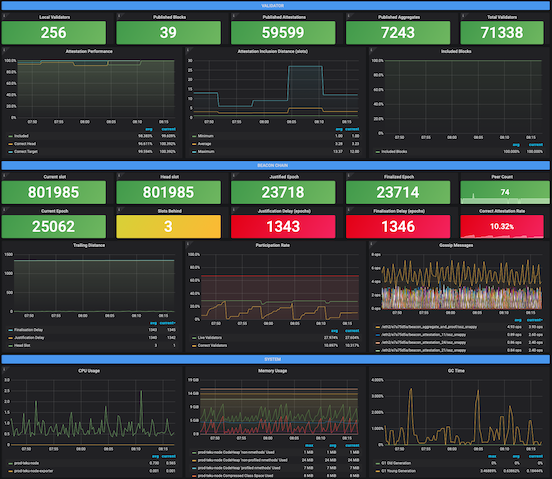
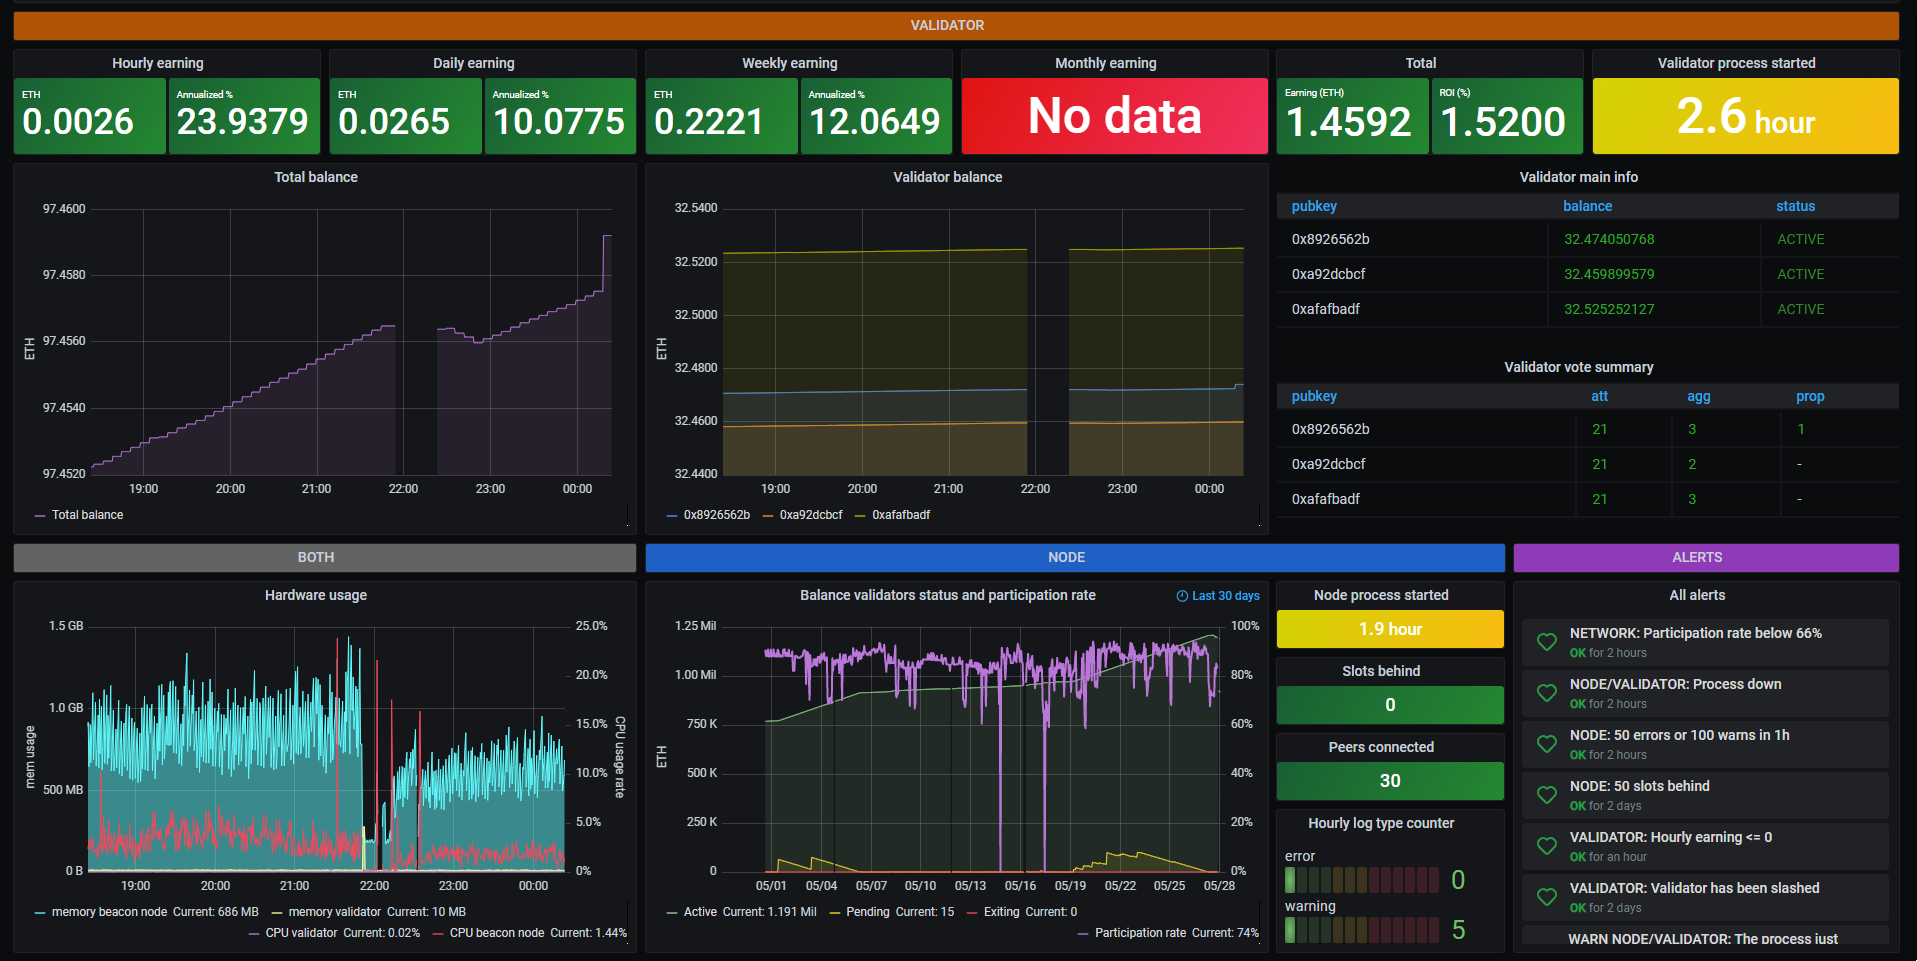
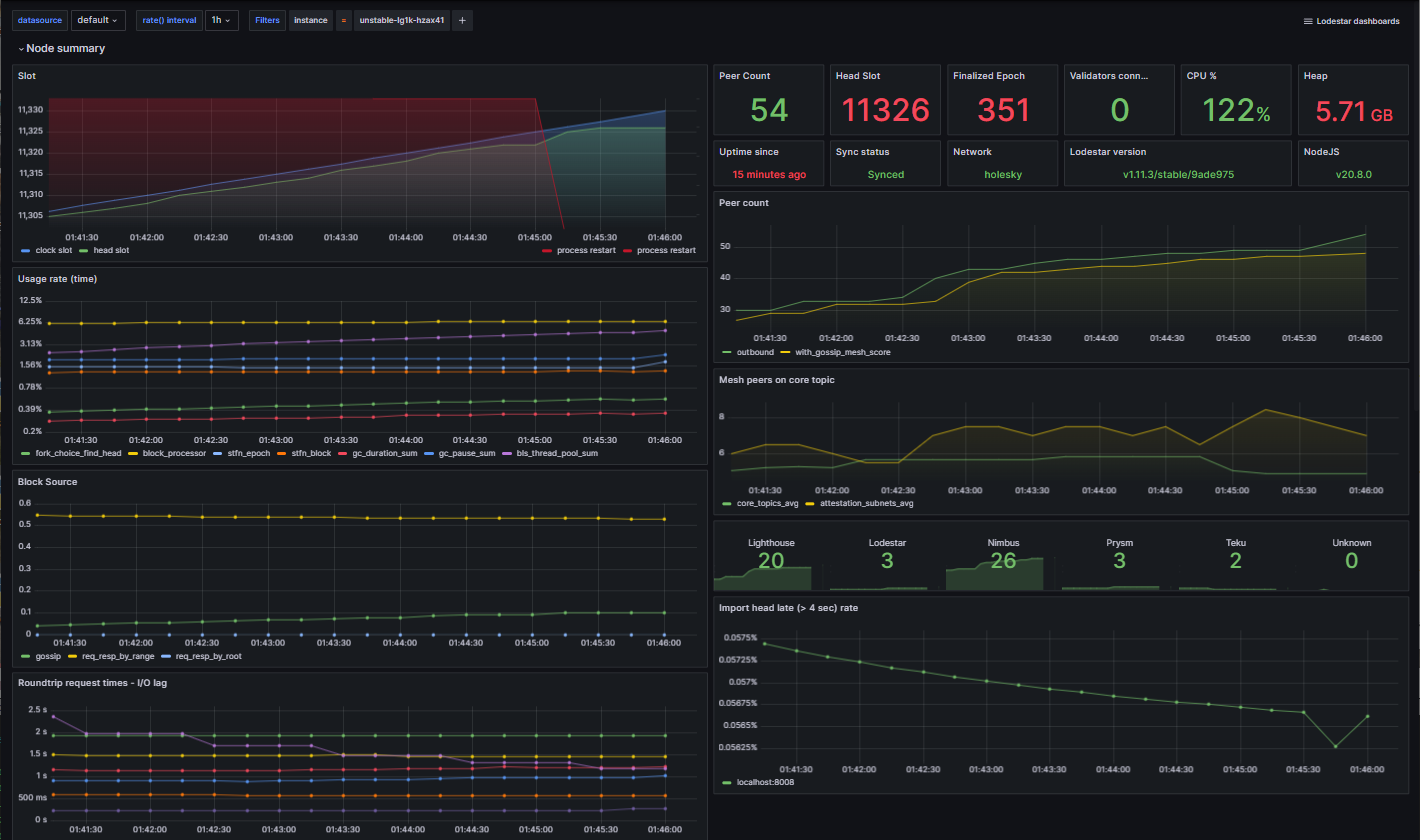
Example of Grafana Dashboards for each consensus client.
- Lighthouse
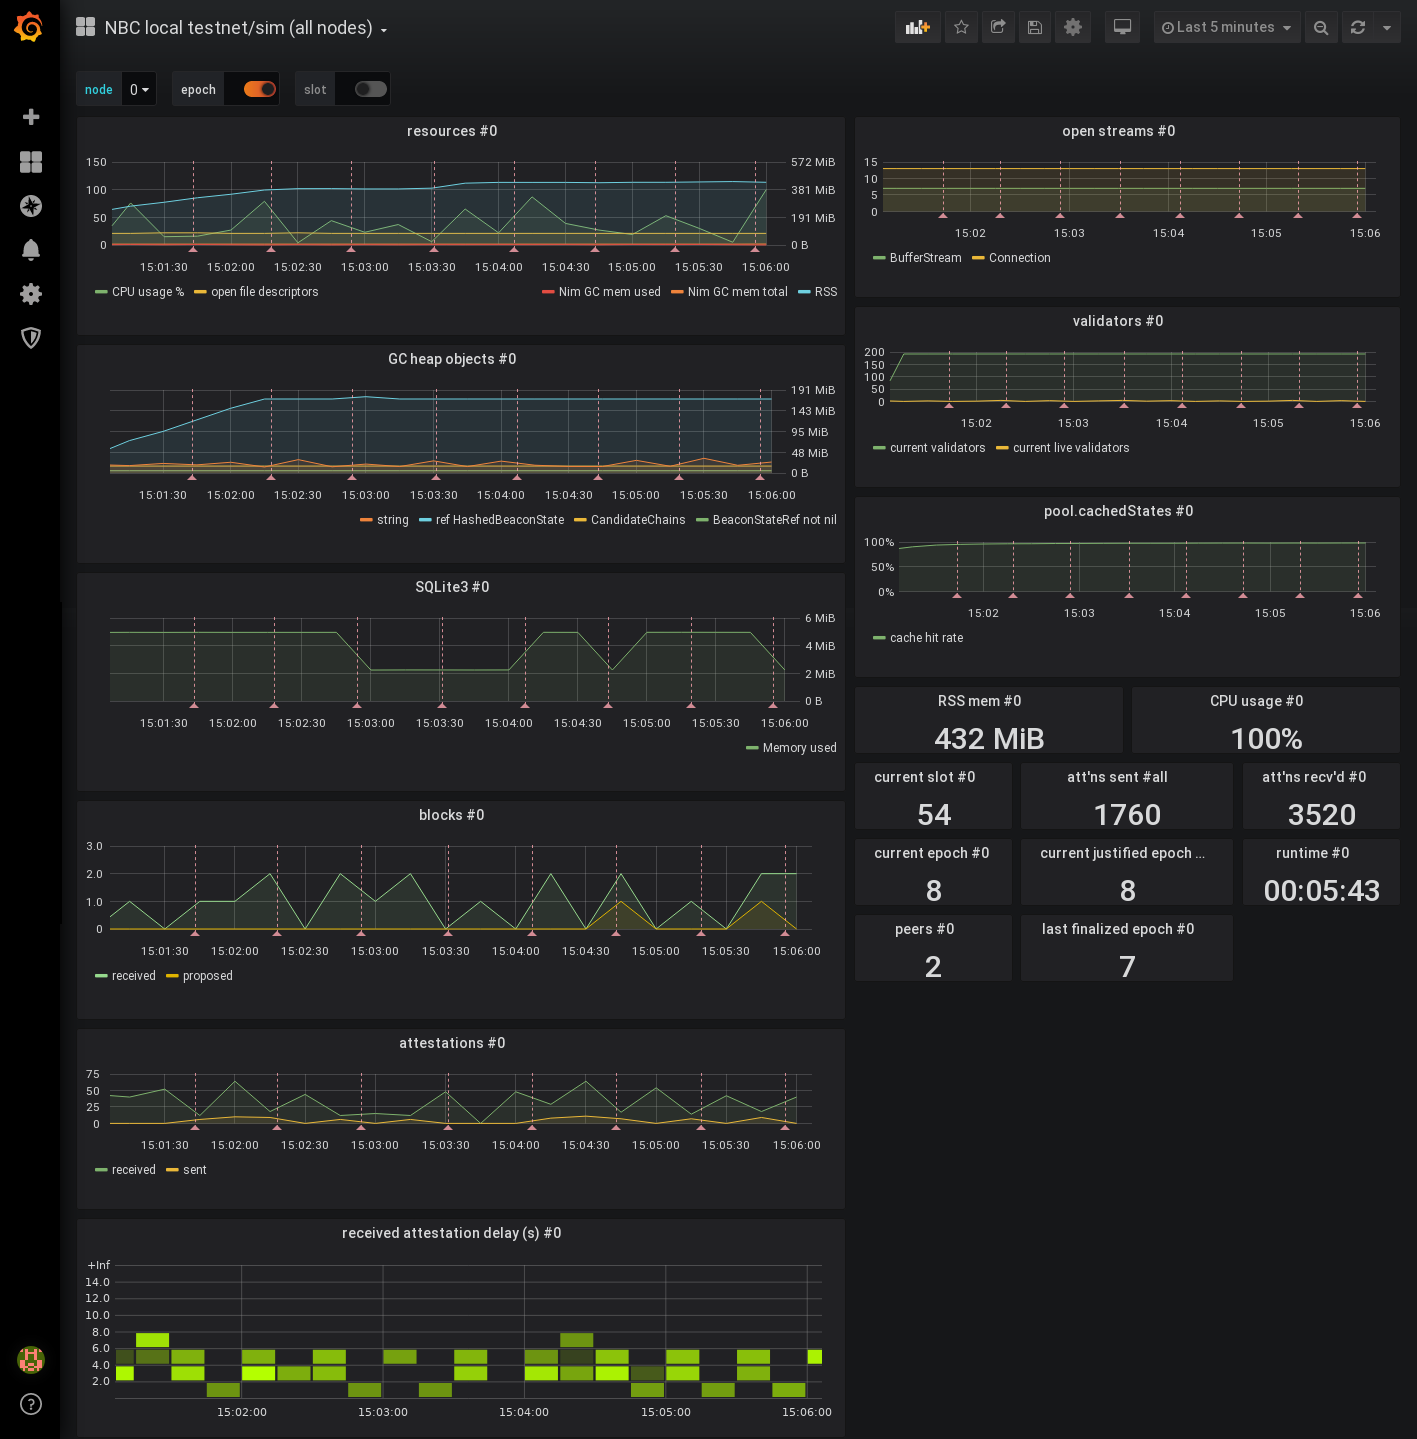
- Nimbus
- Teku
- Prysm
- Lodestar
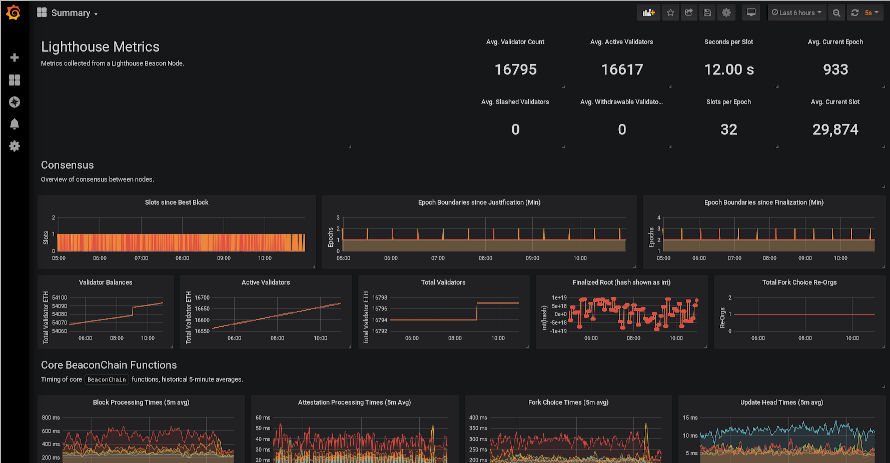

Beacon Chain JSON Download link: https://raw.githubusercontent.com/sigp/lighthouse-metrics/master/dashboards/Summary.json
Validator Client JSON download link: https://raw.githubusercontent.com/sigp/lighthouse-metrics/master/dashboards/ValidatorClient.json
Credits: https://github.com/sigp/lighthouse-metrics/
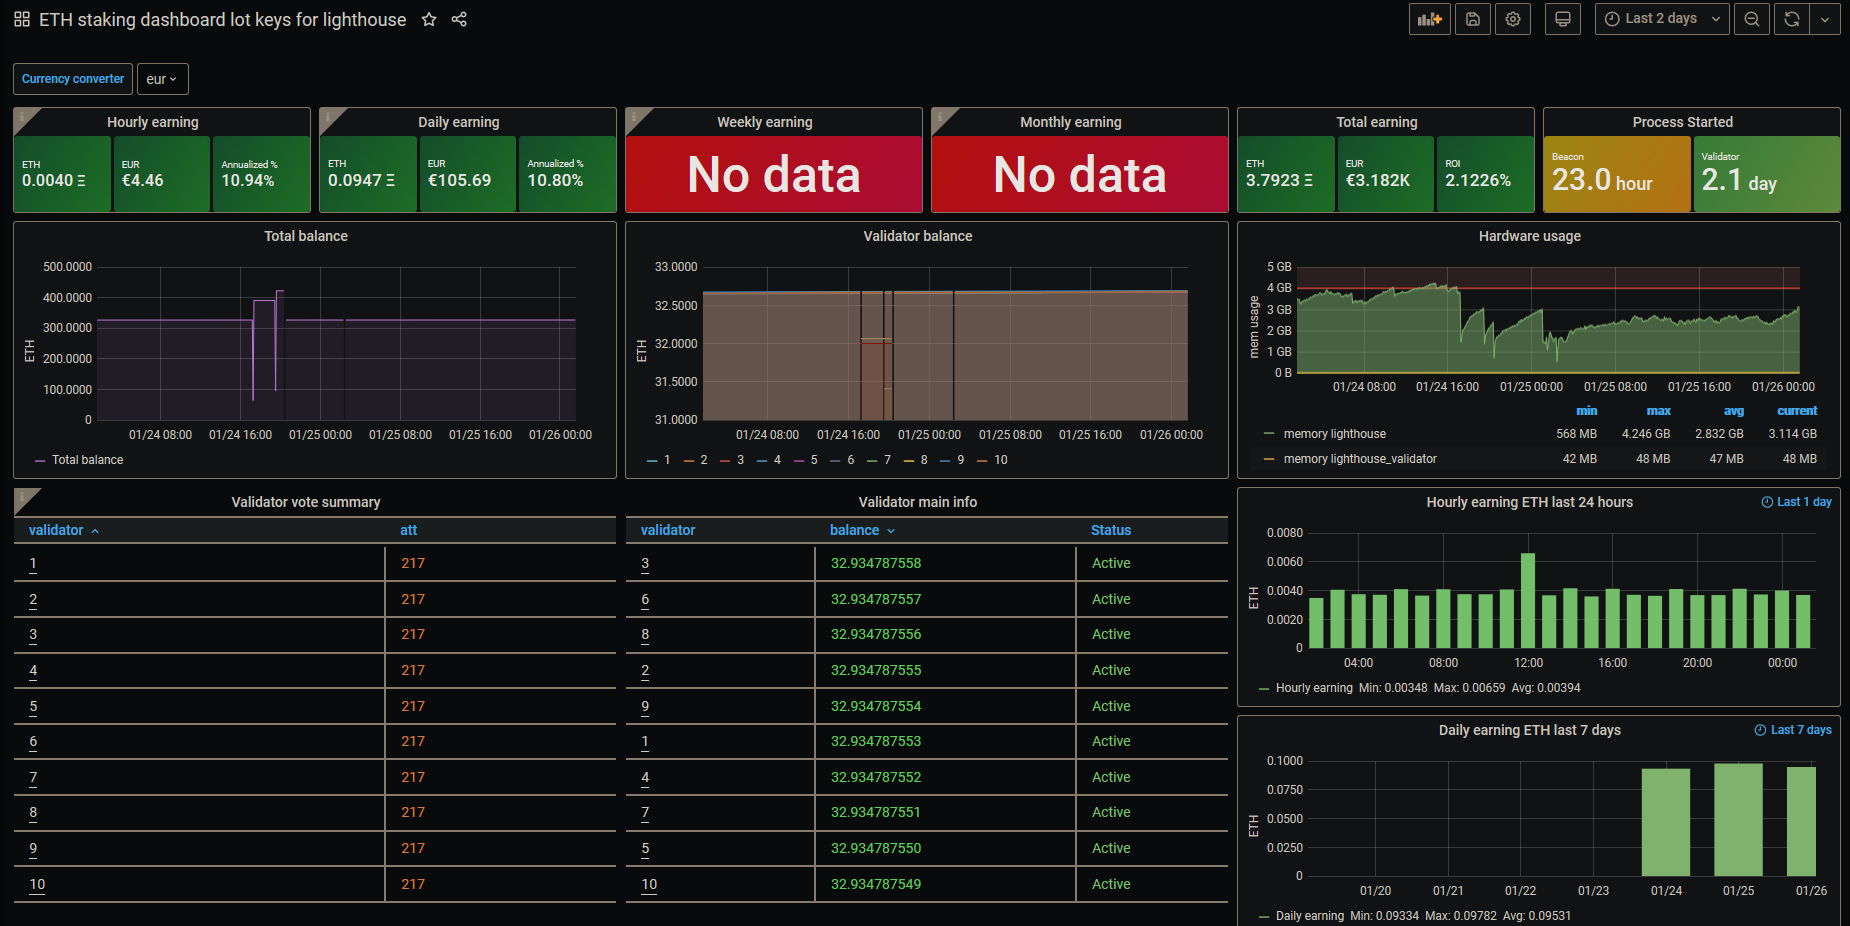
JSON Download link: https://raw.githubusercontent.com/Yoldark34/lighthouse-staking-dashboard/main/Yoldark_ETH_staking_dashboard.json
Credits: https://github.com/Yoldark34/lighthouse-staking-dashboard
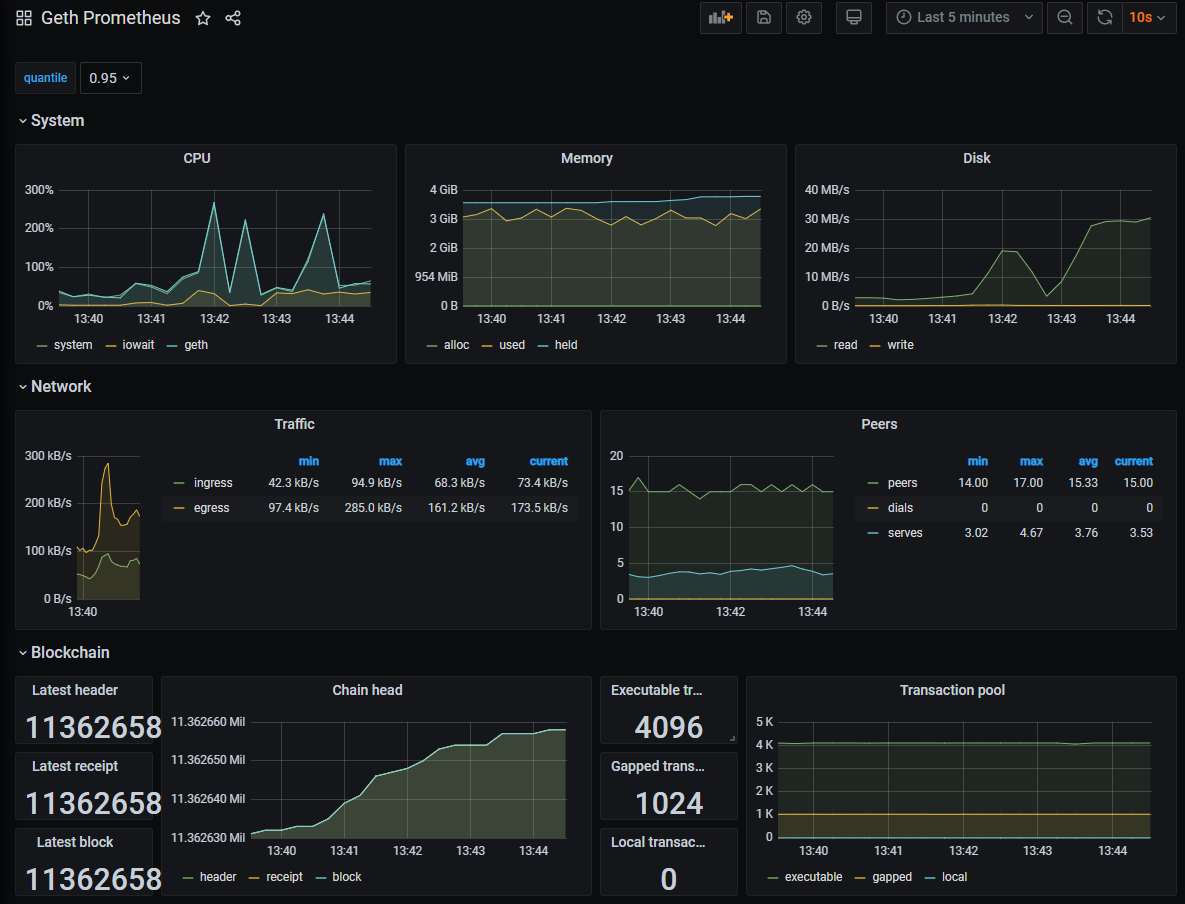
Example of Grafana Dashboards for each execution client.
- Geth
- Besu
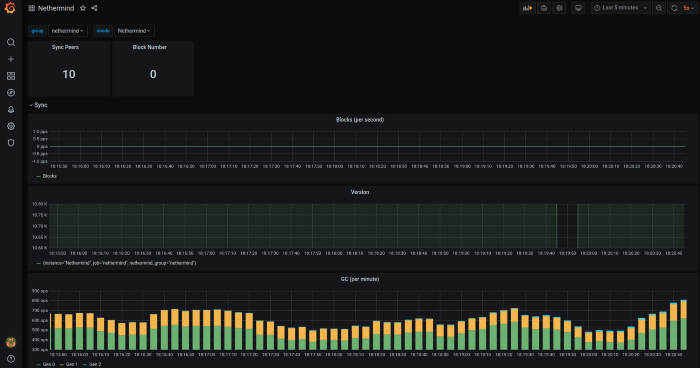
- Nethermind
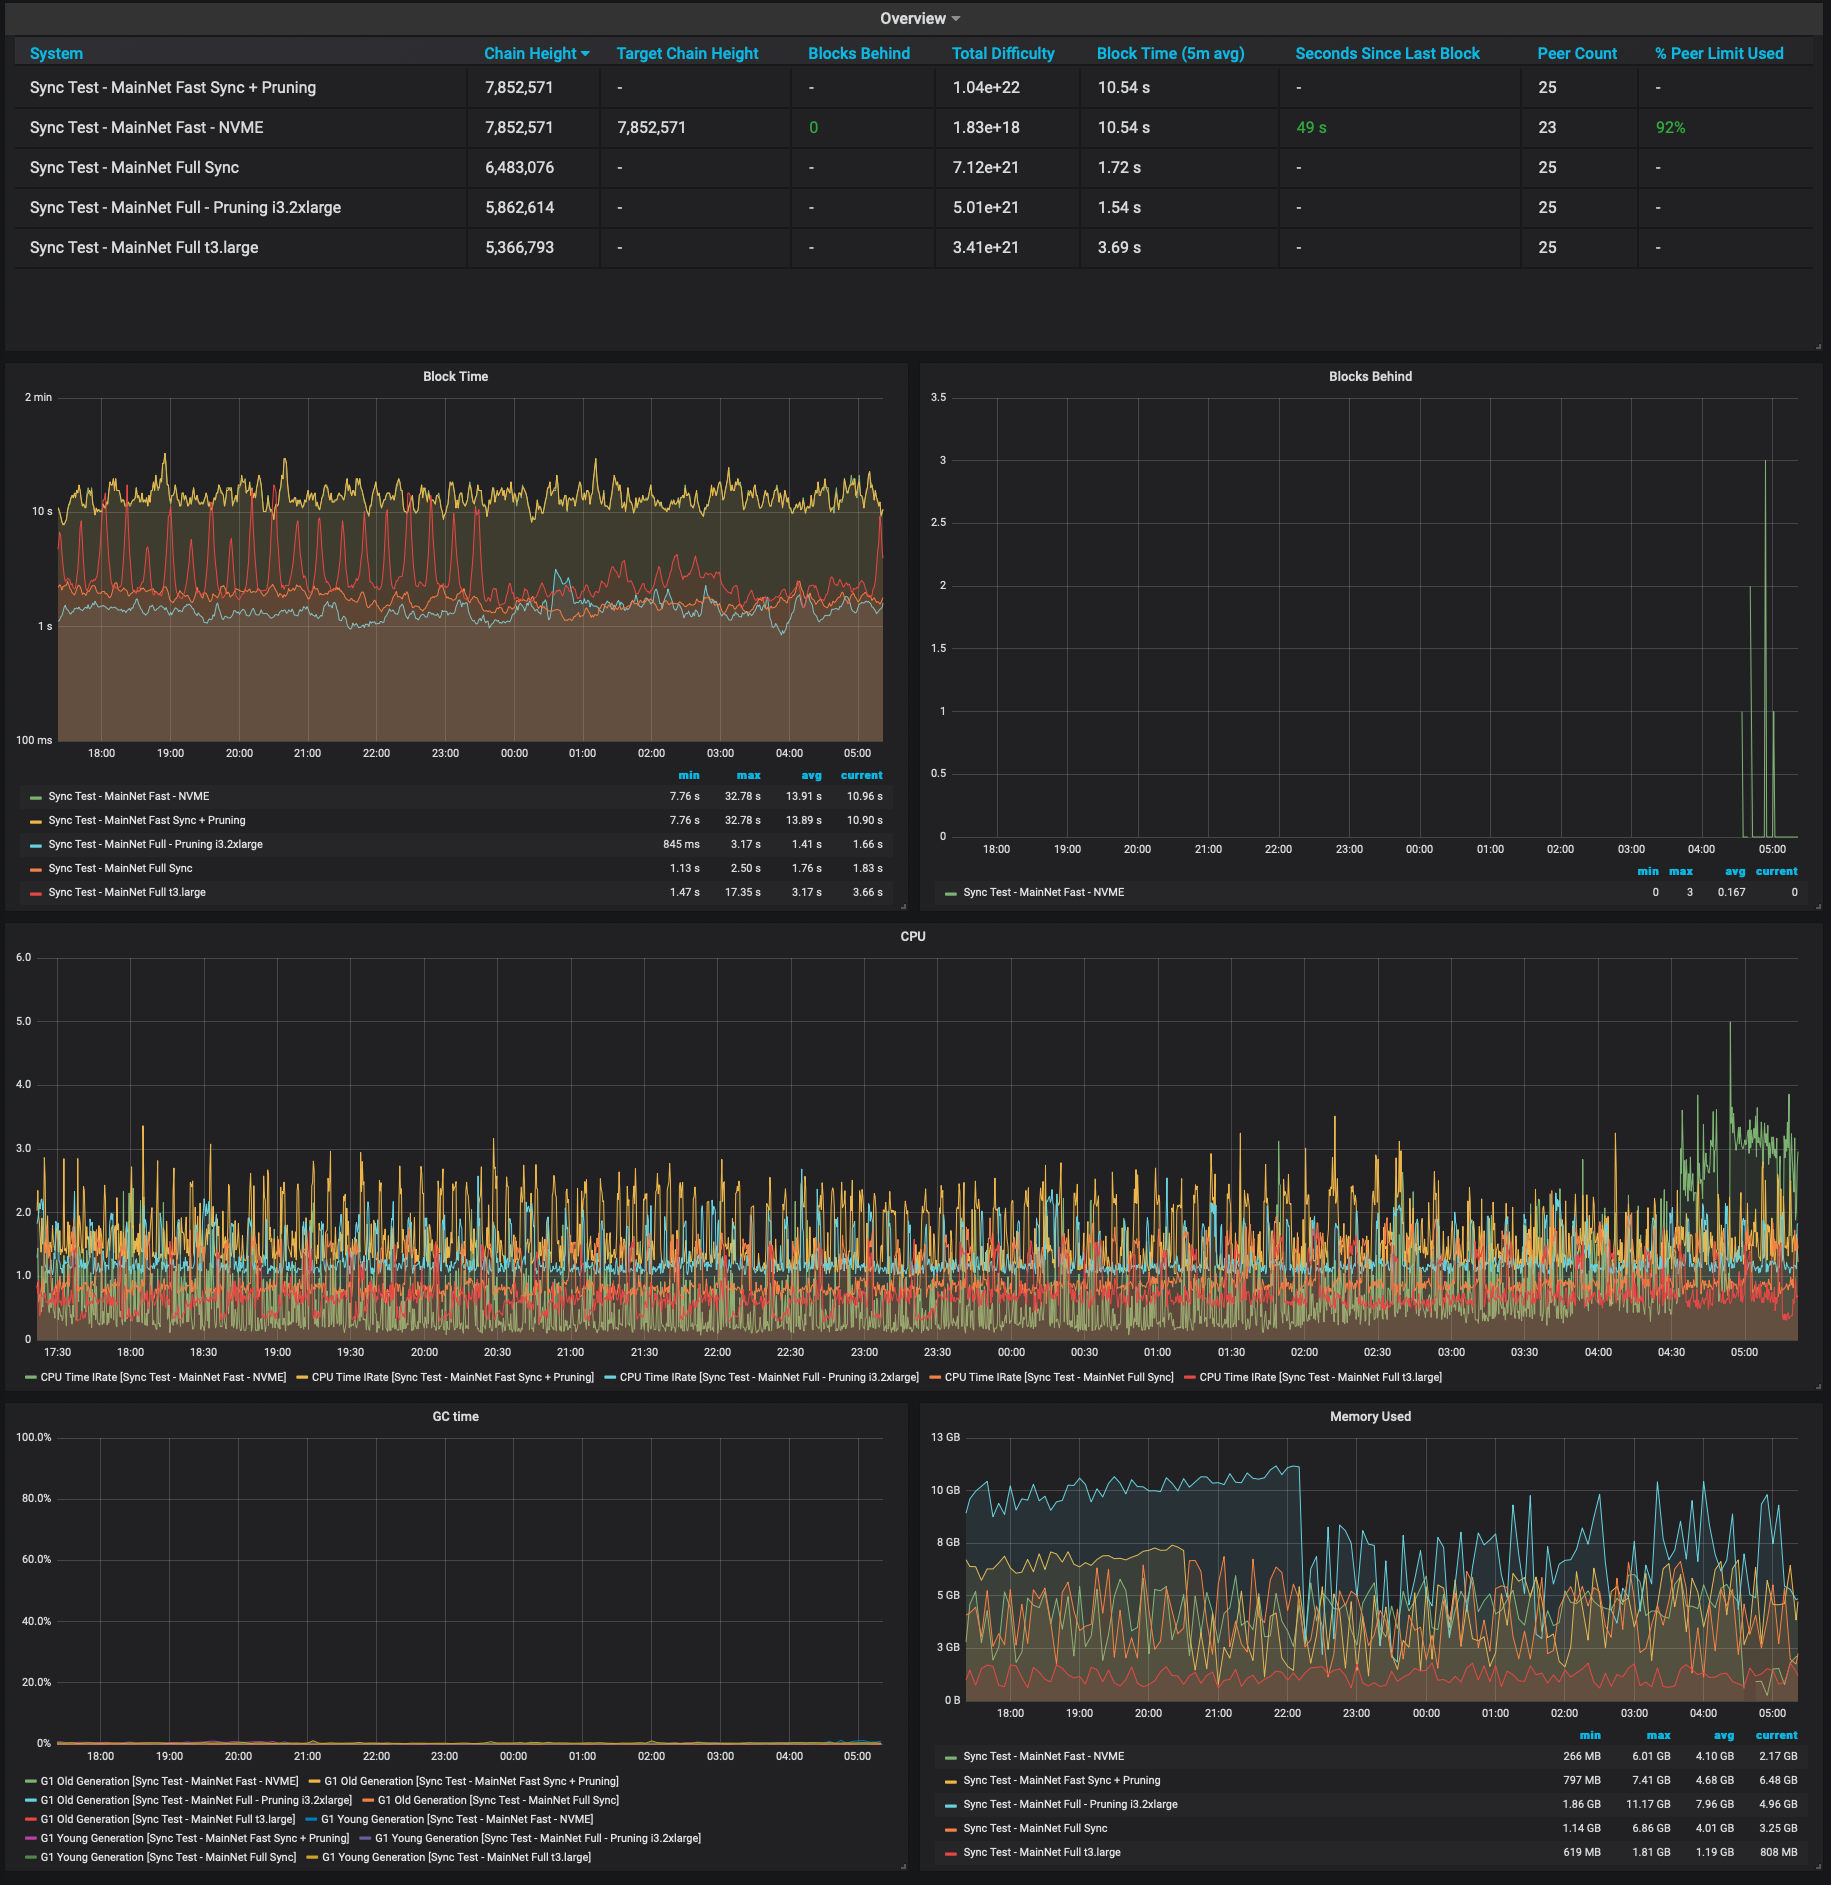
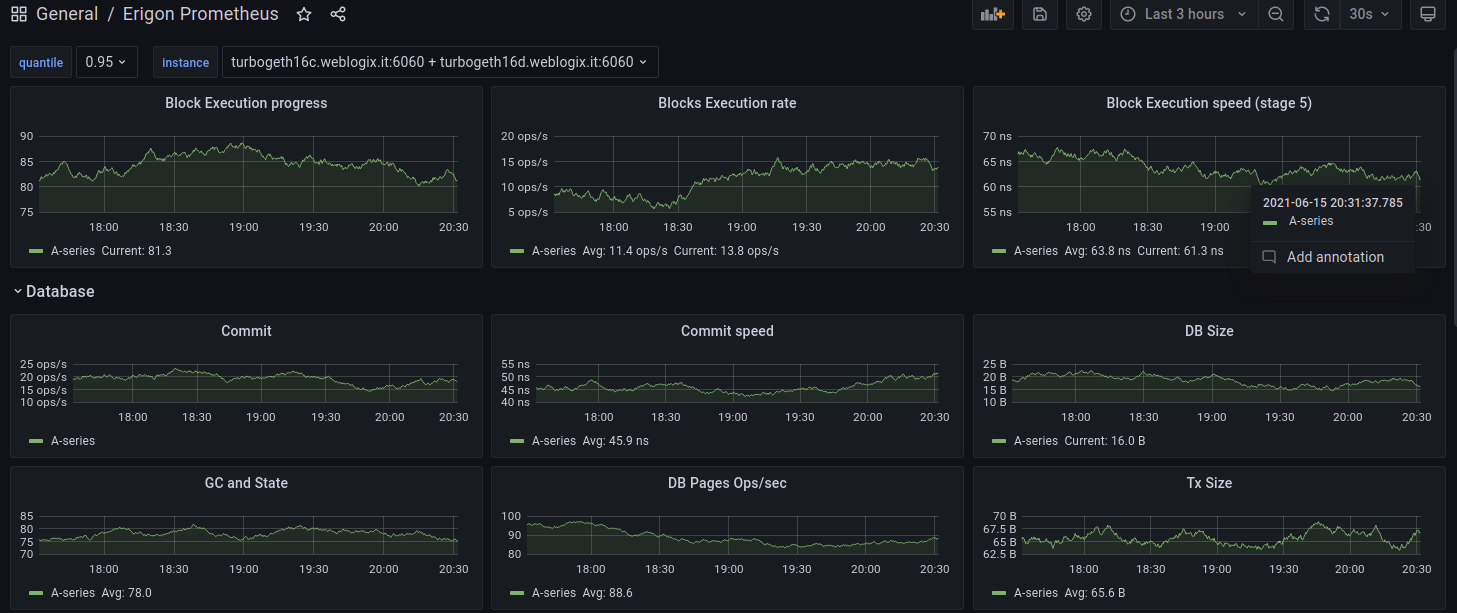
- Erigon
- Reth
Example of Node-Exporter Dashboard
- Node-Exporter Dashboard by starsliao
General system monitoring
Includes: CPU, memory, disk IO, network, temperature and other monitoring metrics。
-3825c4ca277a328cdfb797e87637e66f.png)
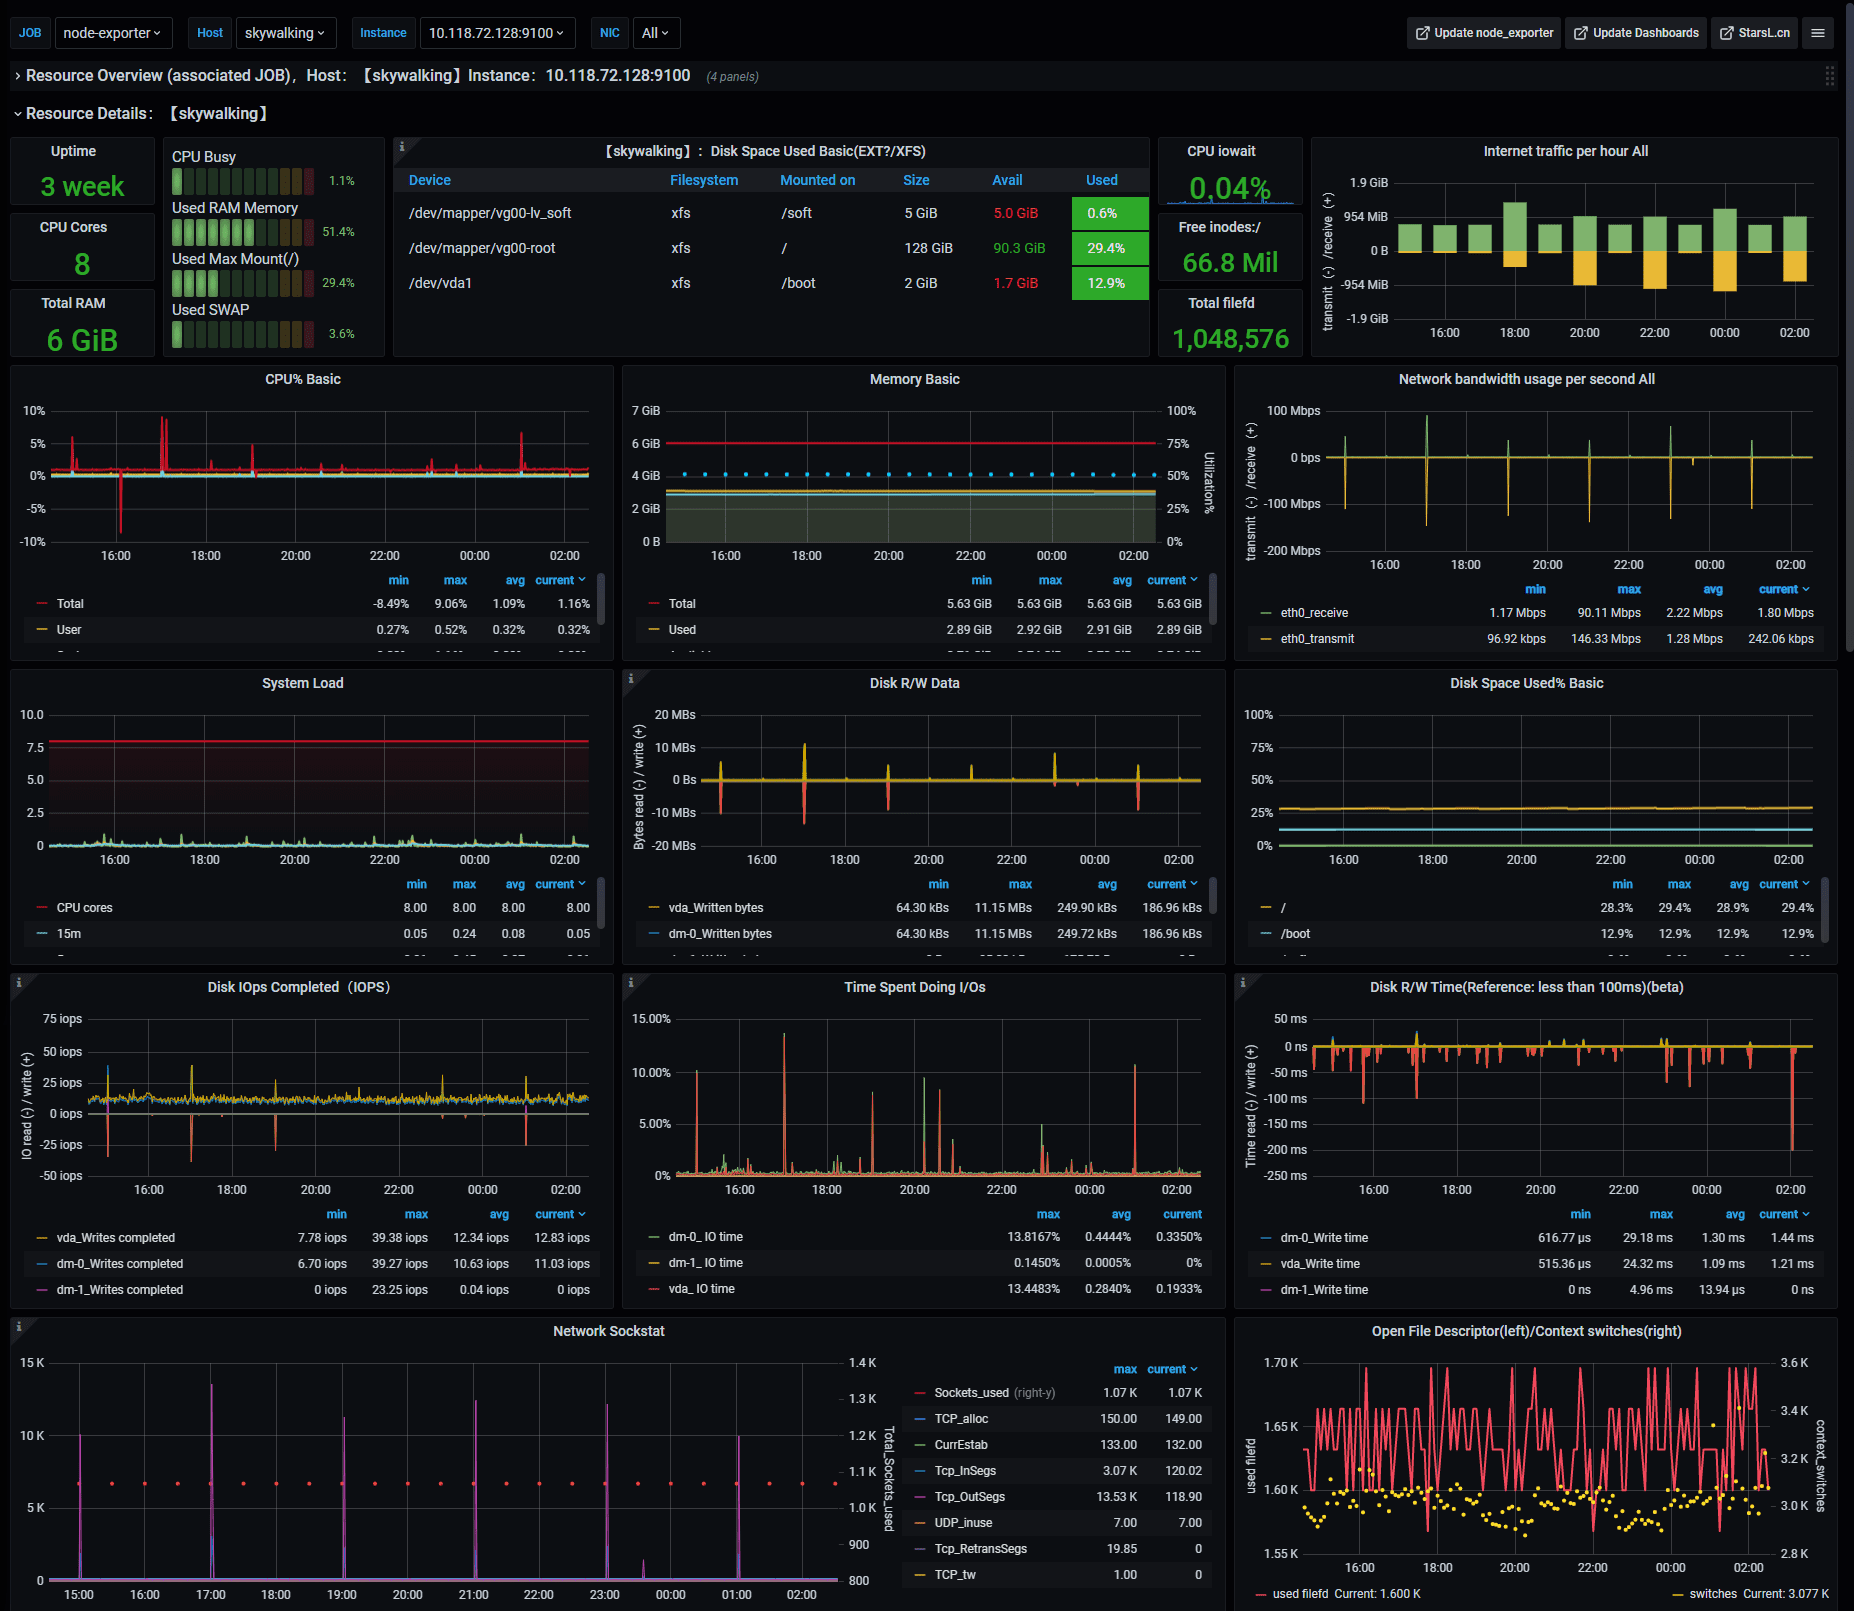
Credits: starsliao
8. Setup Alert Notifications
Setup alerts to get notified if your validators go offline.
Get notified of problems with your validators. Choose between email, telegram, discord or slack.
Option 1: Email Notifications
- Visit https://beaconcha.in/
- Sign up for an account
- Verify your email
- Search for your validator's public address
- Add validators to your watchlist by clicking the bookmark symbol.
Option 2: Telegram Notifications
-
On the menu of Grafana, select Alerting.
-
Click on Contact points menu, then +Create contact point button.
-
Give the contact point a name.
-
Select Telegram from the Integration list.
-
To complete the Telegram API settings, a Telegram channel and **bot **are required. For instructions on setting up a bot with
@Botfather, see this section of the Telegram documentation. You need to create a BOT API token. -
Create a new telegram group.
-
Invite the bot to your new group.
-
Type at least 1 message into the group to initialize it.
-
Visit
https://api.telegram.org/botXXX:YYY/getUpdateswhereXXX:YYYis your BOT API Token. -
In the JSON response, find and copy the Chat ID. Find it between **chat **and title. Example of Chat ID:
-1123123123"chat":{"id":-123123123,"title": -
Paste the Chat ID into the corresponding field in Grafana.
-
Save and test the notification channel for your alerts.
-
Now you can create custom alerts from your dashboards. Visit here to learn how to create alerts.
Option 3: Discord Notifications
- On the menu of Grafana, select Alerting.
- Click on Contact points menu, then +Create contact point button.
- Give the contact point a name.
- Select Discord from the Integration list.
- To complete the set up, a Discord server (and a text channel available) as well as a Webhook URL are required. For instructions on setting up a Discord's Webhooks, see this section of their documentation.
- Enter the Webhook URL in the Discord notification settings panel.
- Click Send Test, which will push a confirmation message to the Discord channel.
- Now you can create custom alerts from your dashboards. Visit here to learn how to create alerts.
Option 4: Slack Notifications
- On the menu of Grafana, select Alerting.
- Click on Contact points menu, then +Create contact point button.
- Give the contact point a name.
- Select Slack from the Integration list.
- For instructions on setting up a Slack's Incoming Webhooks, see this section of their documentation.
- Enter the Slack Incoming Webhook URL in the URL field.
- Click Send Test, which will push a confirmation message to the Slack channel.
- Now you can create custom alerts from your dashboards. Visit here to learn how to create alerts.